As we’ve noted before, index rebalance days tend to result in much larger closing auctions. That’s because most index funds try to exactly match what their index provider does – and index changes happen using the official closing price.
For example, a typical close accounts for less than 10% of volume traded during the day; meanwhile, some index rebalance dates see over 30% of volume traded in the close.
Based on this knowledge, we can use the size of the closing trades on index addition days to estimate total index fund tracking. The results show that many companies might have around a quarter of all float-shares bought by different index funds.
It’s important to note that companies benefit from being added to major indexes as they see significant new (and typically long-term) investors.
Index rebalance days have large close volumes
As the data in the chart below shows, there are just a few dates each year index trades typically happen:
- MSCI is (typically) at the end of May and November. S&P, Nasdaq and FTSE indexes rebalance on the third Friday of the last month in the quarter. That’s also “quad witch” day, which makes the close volumes even higher.
- Russell rebalances their indexes once a year, usually on the last Friday in June that is not quarter end.
Chart 1: Index rebalance days see exceptionally large closing volumes
A typical close currently adds to around $40 billion in trading, which is less than 10% of the volume traded during the day (grey dots).
In contrast, S&P and Russell index dates see an average $240 billion trading in the close, adding to over 30% of the day’s closing volume, and significantly elevating the total trading during the day (ADV), too. Even MSCI rebalances cause the close to increase to around 20% of ADV.
Using closing trading to estimate index tracking
There are two ways we can estimate how much index funds tracking each index adds:
- Top down: Sometimes index providers disclose how much money tracks their indexes. Some academics have also added up all the index fund holdings from 13F filings. You could even try to reconcile that to ICI disclosures that nowadays say index funds are around 50% of all mutual funds.
- Bottoms up: Another way is behavioral – to look at how many shares actually trade on the index rebalance dates. Knowing that index funds only really need to trade on the rebalance date, and that in order to accurately track the index before market open the next day, many funds prefer to trade at the same time as the benchmark is changed (which is the close!), representing another way to see how big index funds might be.
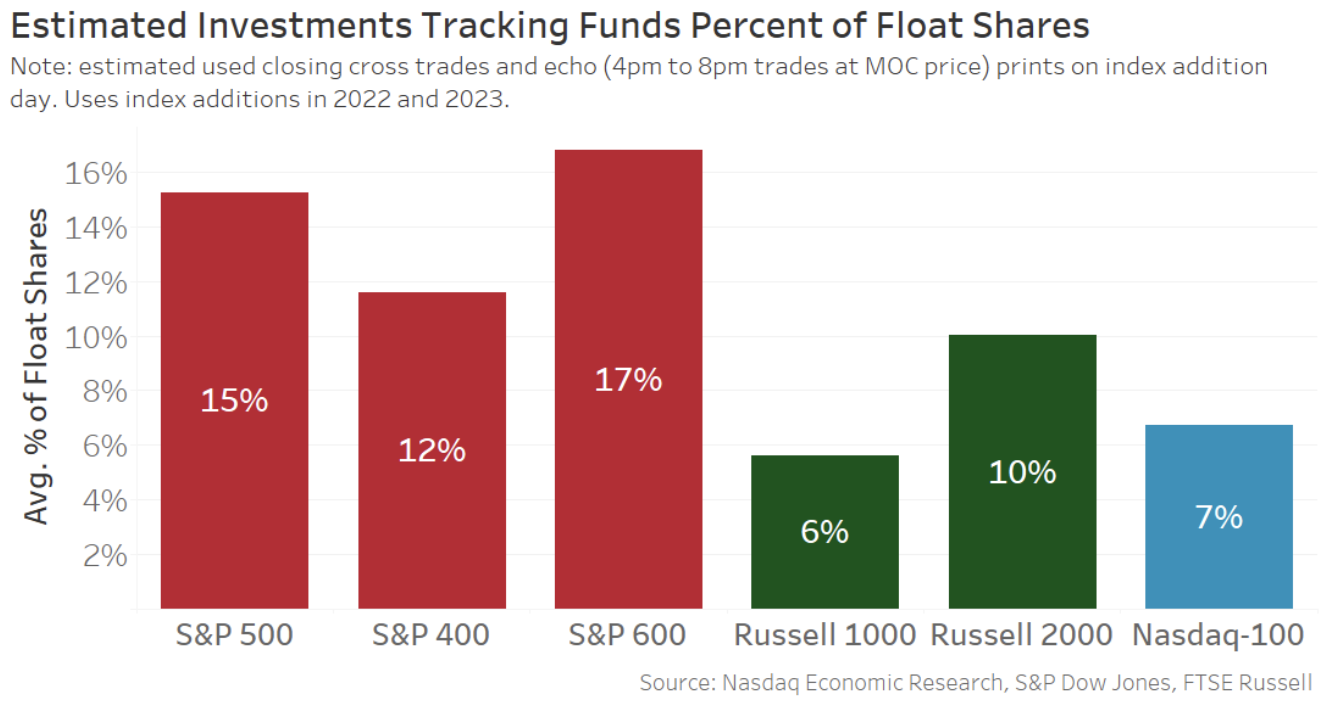
Today, we use the bottoms up approach to see how many float-shares actually trade on rebalance dates across the major U.S. indexes. The results (Chart 2) show that:
- Small caps actually have significant proportion of index tracking, 27% total in the S&P 600 and Russell 2000.
- Although, a large cap can qualify for all three major indexes, including the Nasdaq-100®, it could have up to 28% of its float shares held by index funds.
Even though far more dollars are indexed to the S&P 500, as much as $7.5 trillion, it’s the proportion of each company’s float shares that we are measuring here – and that should be consistent across all companies in each index.
Chart 2: Index day close trading indicates index tracking funds could own around 25% of float shares in many companies

Importantly, neither the top-down nor bottom-up approach is perfect. Some futures and options hedges might trade like index funds, while actual index funds might pre-position to try to limit market impact from the predictable index trade. Some also claim that some active funds trade like “closet indexers.”
Closing volumes need to include some off exchange trades now too
Off-exchange trading is becoming larger and larger. That’s also true in the close.
Exchanges and brokers can both publish so-called “echo prints” that copy the official close price (MOC) but print to the “tape” after they find out what the official close price is.
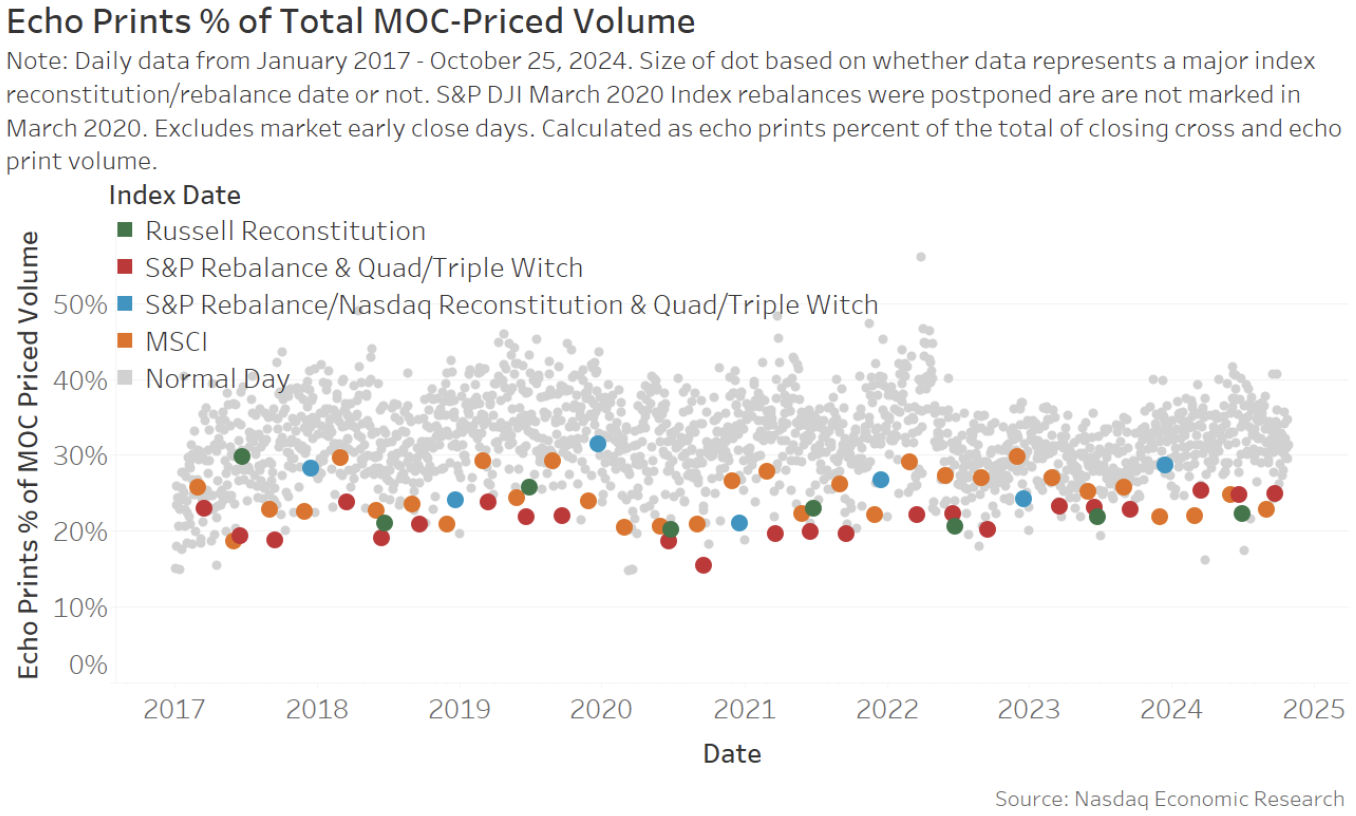
In this study, we add the echo print trades that occur from 4 p.m. to 8 p.m. and are at the MOC price – to the “MOC volumes” we use above. Interestingly:
- On a typical day, we see the echo prints average around 30% of the MOC volumes (grey dots in Chart 3).
- On an index rebalance day, the official close seems more important, with echo prints adding to around 20% of all trades.
Chart 3: Echo prints contribute a consistent proportion of total MOC-priced trading

Normal close trading is likely a fraction of trading on index rebalance dates
Some might also wonder if we shouldn’t remove “normal”, or non-index, MOC volume from the totals above. Especially given we have previously said that the MOC is typically more active (and less index) than people think.
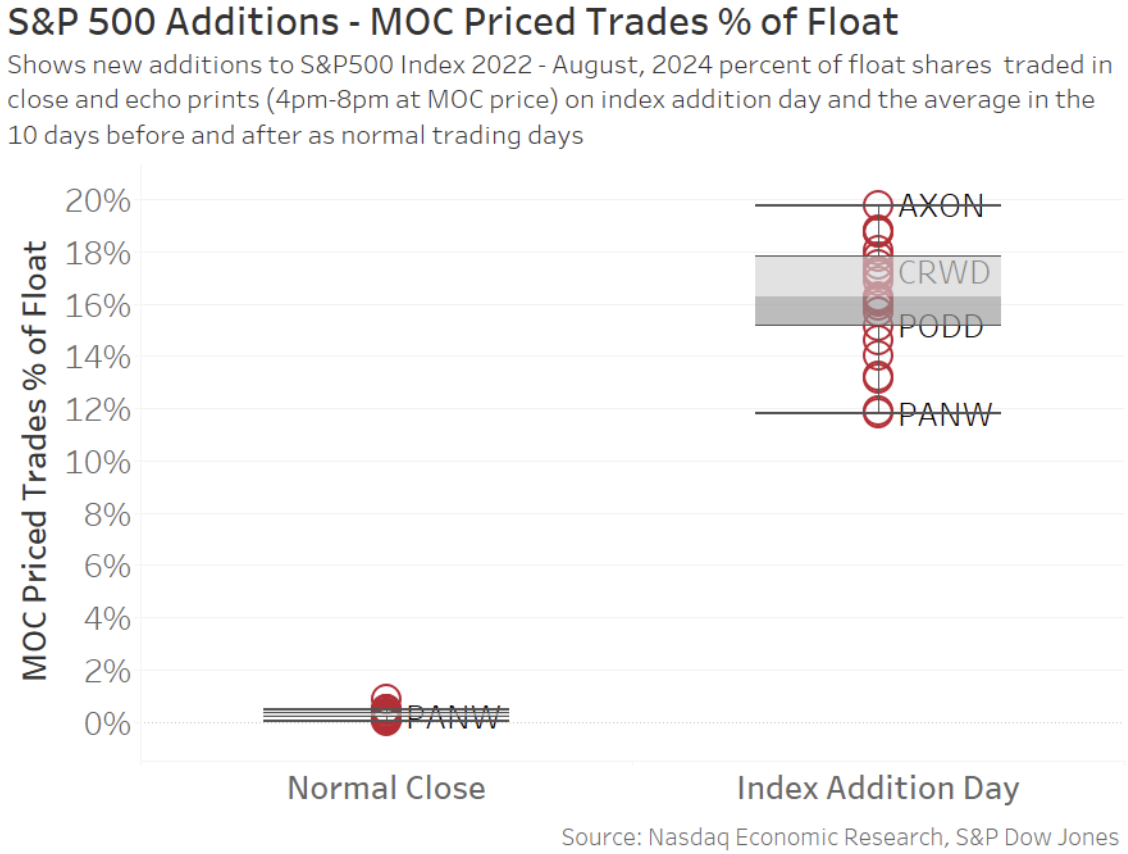
However, when we look at how much volume trades in a “normal” close – and compare it to how much trading that we see on index addition dates – we see that any adjustment would be a rounding error (as Chart 4 shows).
The reason index trades appear so much larger in this view is because the data in chart 1 is for the whole market – while index trades typically affect just the added stocks – so the effect is magnified (or focused) on the index add stock.
This also highlights how important index additions are for companies. They result in a material fraction of total float shares being bought by index funds – and index funds are typically long-term holders.
Chart 4: The “normal” MOC activity is a fraction of the index trading on a rebalance day

The data in Chart 4 also shows the typical dispersion of results that we average in Chart 2. Although the average S&P 500 addition adds to 16% of a company’s float shares the actual trade typically ranges from 14% to 18%, and sometimes much more.
It’s also worth noting that most S&P additions happen away from quad witch. That’s important, as quad witch trading might otherwise exaggerate the S&P results.
Typically, the S&P quarterly rebalance includes “other” index changes, like float, style and shares outstanding updates. Because the S&P 500 is a “500 company” index at all times, additions are typically made whenever another company leaves the index (often through M&A). Although, to be fair, the past few quarterly rebalances have included some promotions and demotions to reallocate stocks to more appropriate market cap groups.
Index addition is good for companies
We know that index addition creates a significant amount of liquidity in an added stock.
This research shows just what proportion of float shares change hands, and are likely bought by index funds, on those dates.
Importantly, index addition is mostly good for companies. Index funds are a large, long-term, new investor base. Index inclusion also increases interest from active mutual funds, which may increase access to U.S. capital for future investments.
Nicole Torskiy, Economic Research Senior Specialist, contributed to this article.
from Finance – Techyrack Hub https://ift.tt/JMkusrb
via IFTTT


0 Comments